MorePowerTool Adventures
by Rggcd
7 min read
MorePowerTool is a powerful application which allows the modification of properties otherwise not accessible to ordinary tuning tools.
RDNA 2 is the last AMD GPU generation that isn't completely locked down. All tests and examples were done with an RX 6800.
Let's find out how much of a difference it can make.
Setup
Note: Silicon Lottery means overclock settings may not work for everyone. Going beyond manufacturer limits can break your card!
The easiest way to boost GPU performance with MPT is to increase the card's power limit. However, it must be done in a roundabout way. Many values on the GPU are locked down in such a way that attempting to bypass them causes the card to go into a “safe” mode, capping itself at 500 MHz. Examples of things you'd want to increase, but can’t, are values like SOC/GFX voltage limit, GFX Clock (Core Frequency) limit, and Power Limit slider maximums.
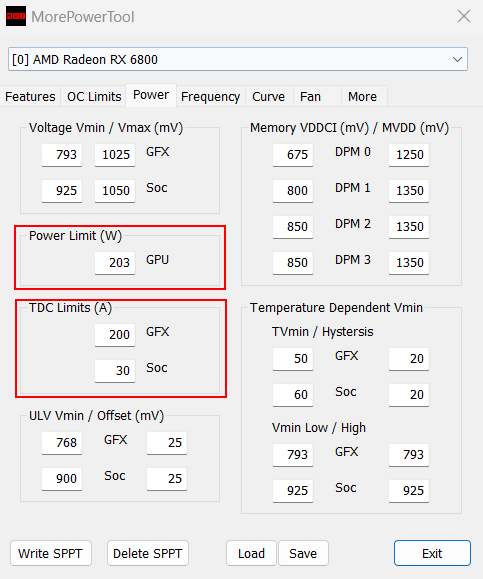
Rather than slider limits, the actual way to increase the power limit is to modify these values:
By bypassing the GPU's power limits, the power delivery is a new factor which needs to be considered. Based on the number of 6- and 8-pin power connectors on the GPU, the maximum (safe) power consumption can be calculated:
- Each 6-pin PCIE cable is rated at 75W (Though they can comfortably pull 100W+)
- Each 8-pin PCIE cable is rated at 150W
- The PCIE slot provides 75W
RDNA 2 cards report their power consumption incorrectly, and actually consume 20-25% more power than they report. For example, my stock RX 6800 reports 203W in every monitoring software, but is actually consuming (and rated at) 250W.
As a result, when taking into account the slider limit, the card’s power consumption looks something like this
\[\text{Total Power Consumption} = (\text{Base Power Limit} * \text{Slider Limit}) * 1.2\]
Changing Power Limit (W) changes the base power.
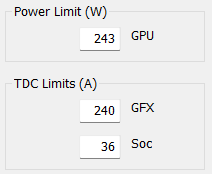
The GFX and Soc current limits should be changed by the same percentage as the power limit.
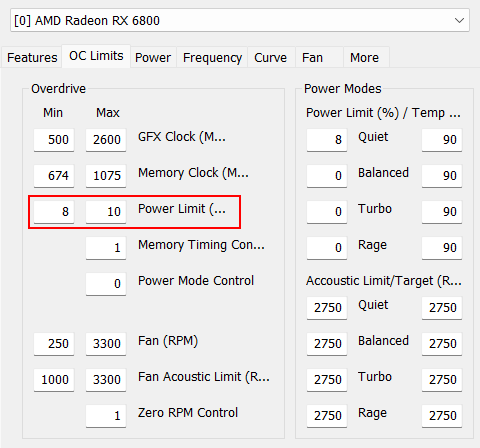
The slider limits are found in the OC Limits tab in MPT. They are the limits of the sliders in tuning programs like AMD Wattman (Adrenalin).
My RX 6800 has 2 8-pin connectors. That is 300W, plus the PCI-E slot’s 75W, totalling at 375W.
This means the card will pull \((243\text{W} * 1.1) * 1.2 = 320\text{W}\), which is still comfortably within the 375W limit.
I then tuned my card to maximize the clock speed within the new power limit. With such high power limits, the card will either run into a clock or voltage limit. Unfortunately, there is no way to increase either via MPT. Attempting to do so causes safe mode to trigger. For my card, I can hit the 2600 MHz limit in just about any workload.
Benchmarks and Results
4 Tested Profiles:
- Low Coil Whine (1800 MHz, 800 mV, 223W limit)
- Stock (Stock, 203W limit)
- Adrenalin OC (2400 MHz, 870 mV, 223W limit)
- MPT OC (2600 MHz, 960 mV, 267W limit)
Test Notes:
- All non-stock tests were run at 2100 MHz Fast Timings.
- Overclocks are stable.
- Power limits above are set power limit, actual power consumption estimates are higher (~20%) and are reflected in the tables below.
- 1% Low means 1st percentile FPS - 99% of fps measurements were greater.
- Driver version 25.8.1.
Test System:
- Intel i7 12700K
- DDR5 6000 C30 (Run at 5600MT)
Games
Metrics were recorded with Adrenalin's built-in logging system.
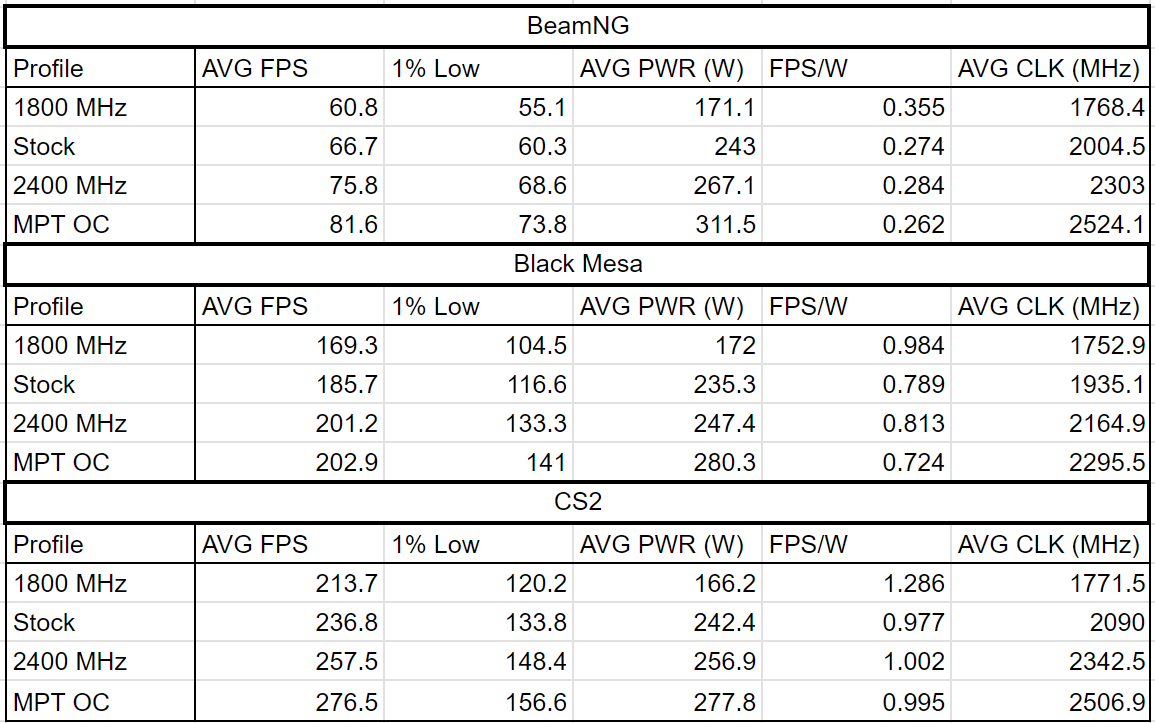
BeamNG drive
- 1440p Ultra + Extra Graphics Mods
- A lap around the Automation Test Track's Off-Road area.
- Default Gavril D-Series, H4, Cabin Camera
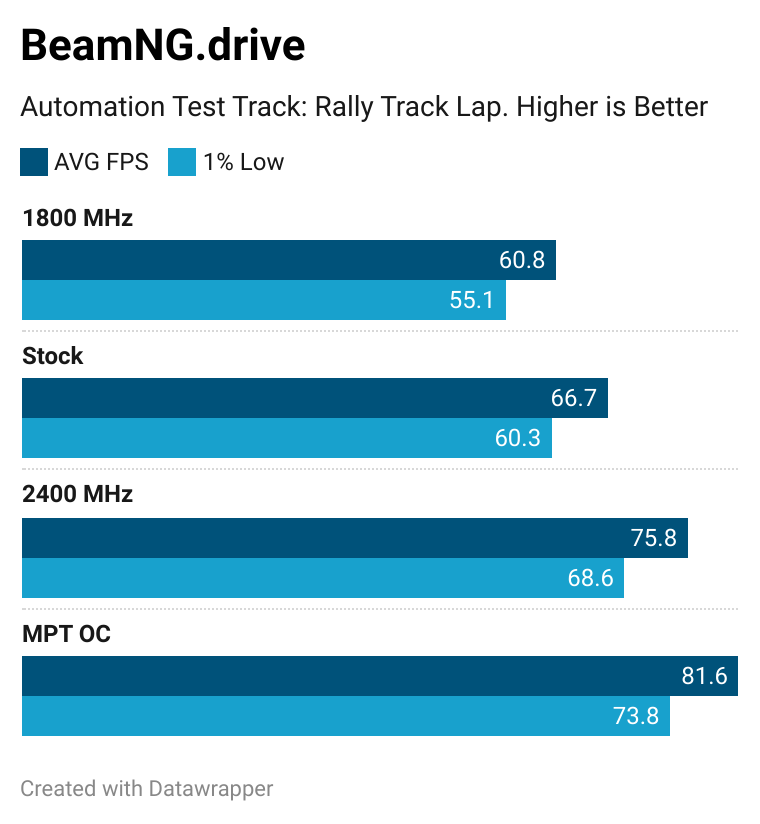
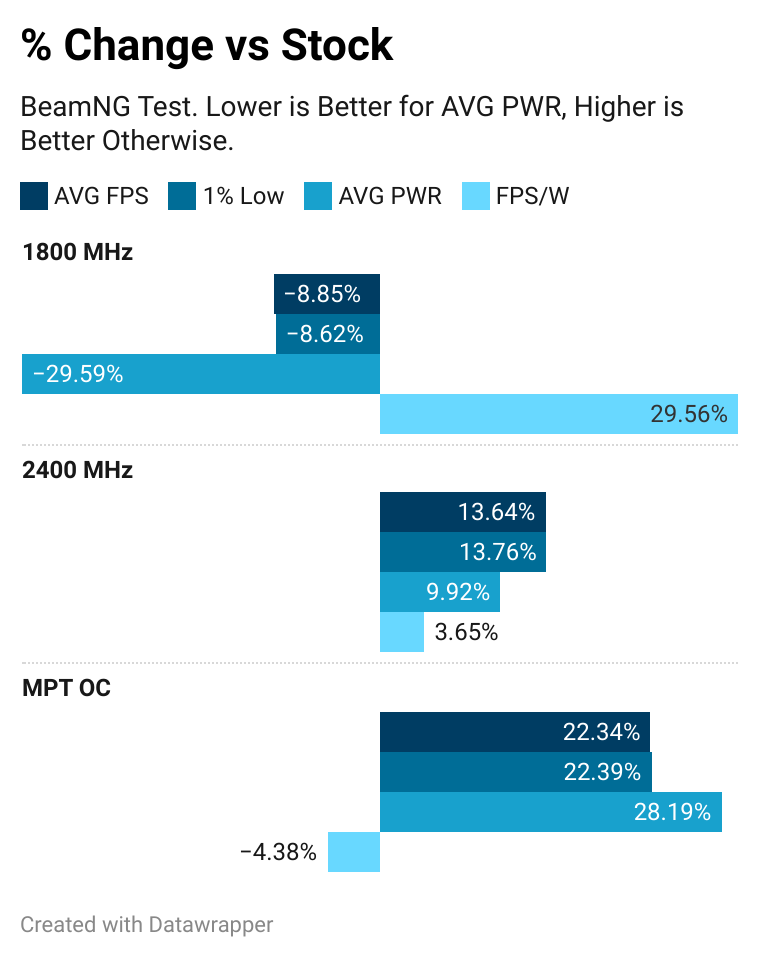
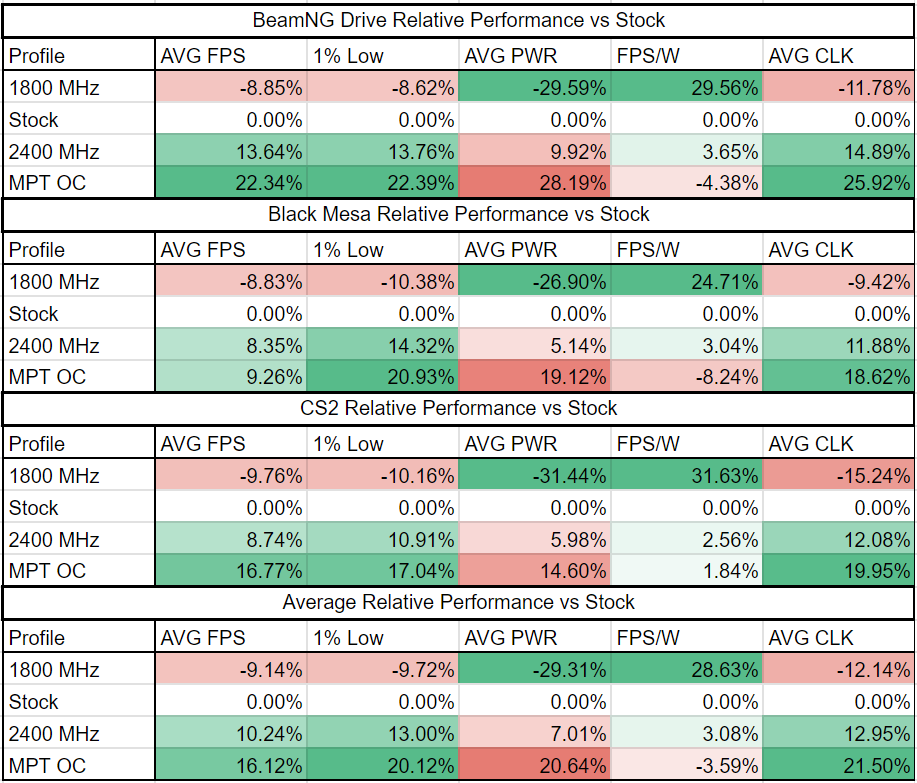
BeamNG showed impressive gains with a 22% average FPS increase with MPT. The average power consumption also scales closely with the power limit increases.
Black Mesa
- 1440p Very High
- A Xen Segment
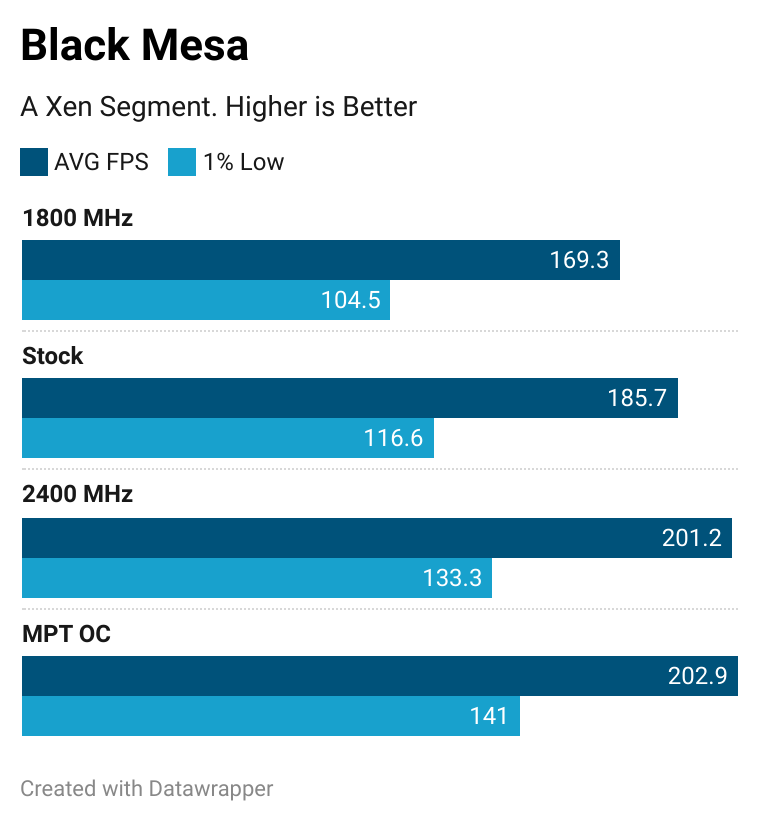
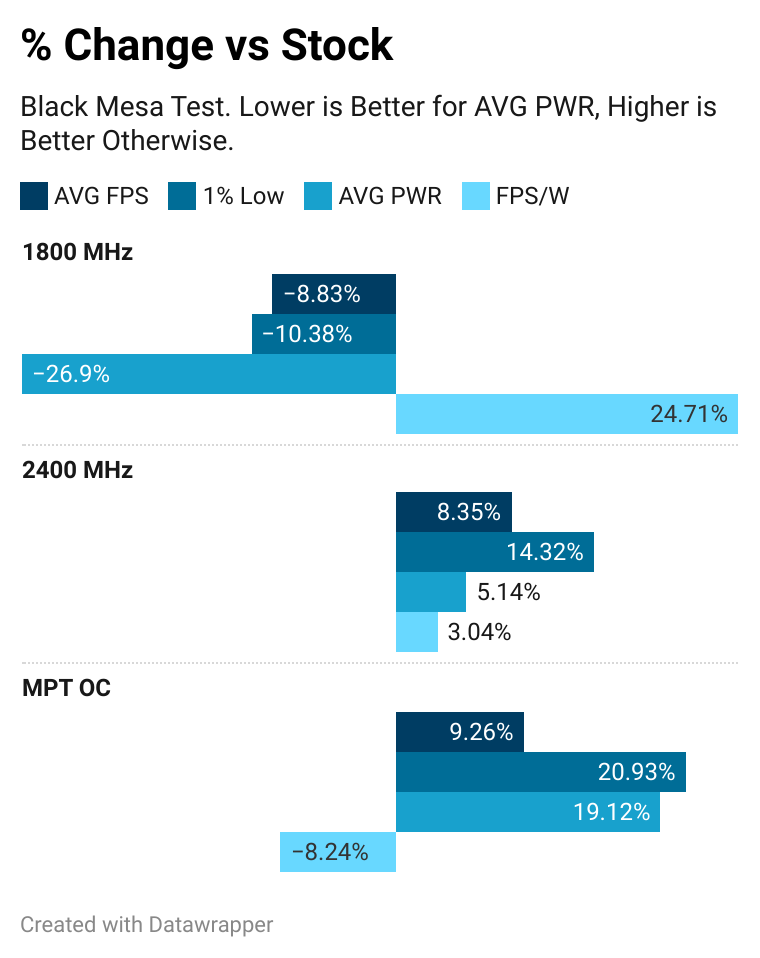
I re-ran the Adrenalin OC and MPT OC tests at 5K, only to get the same <1% difference in average FPS. It seems like the increased voltage canceled out the increased power limit, and both tests had the card run ~100 MHz apart on average. Lowering the MPT Profile's voltage by 90 mV resulted in the 5% increase seen in other tests. Since this causes instability in other games, the best way to get this performance would be to increase the power limit further. I didn't want to go too far with power, so this "outlier" remains in the dataset (IgorsLab says not to go beyond 280W ASIC, and the current MPT OC's limit is 267W. My card is also the cheapest SKU, meaning no improved power delivery).
Curiously, despite average FPS only increasing by 0.8% between the two, the 1% lows increased by 6%, the same percentage as the other games.
Counter Strike 2
- 1440p Very High
- Ancient
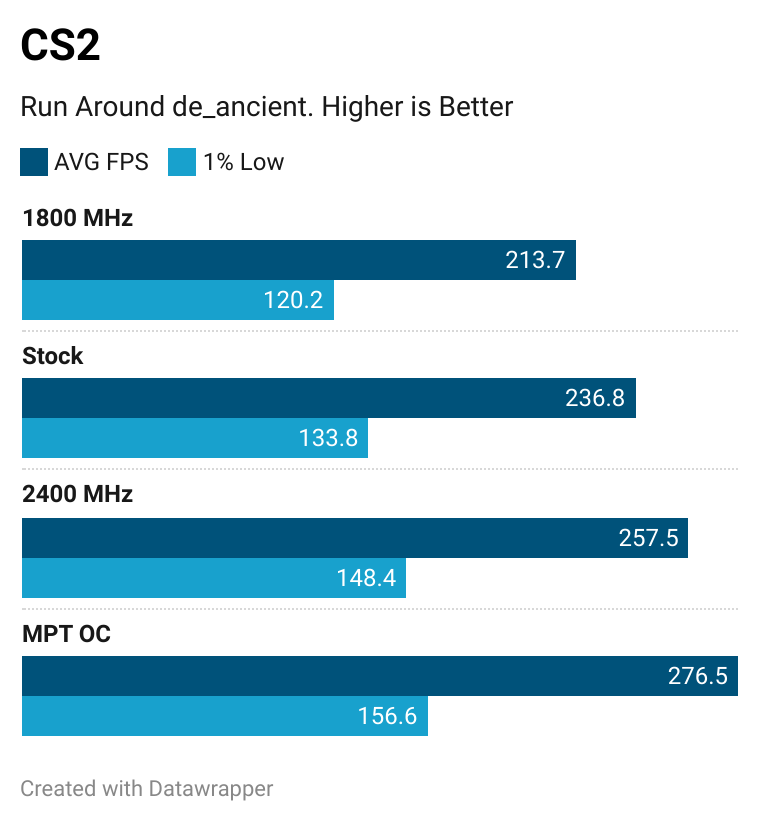
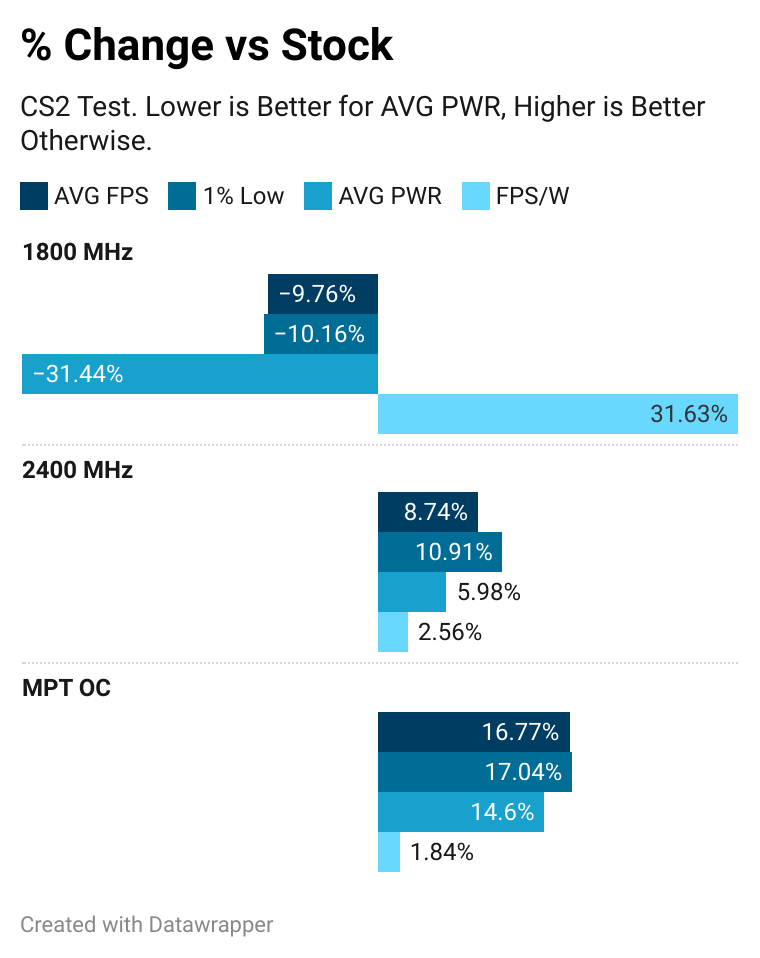
CS2's performance increases were more mild compared to Beam's. Oddly, the MPT OC runs more efficiently than stock.
Benchmarks
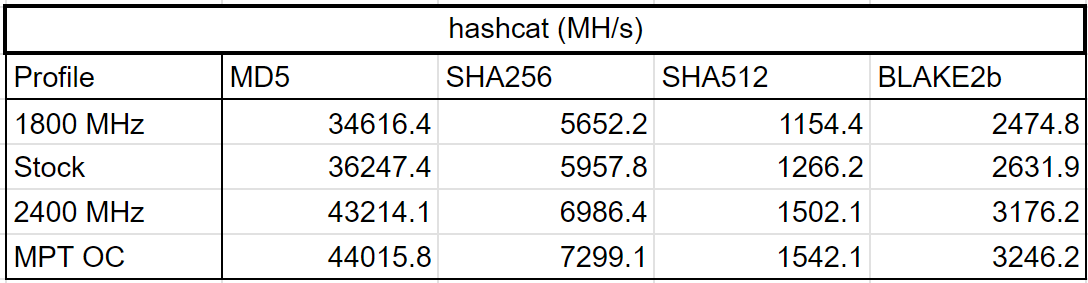
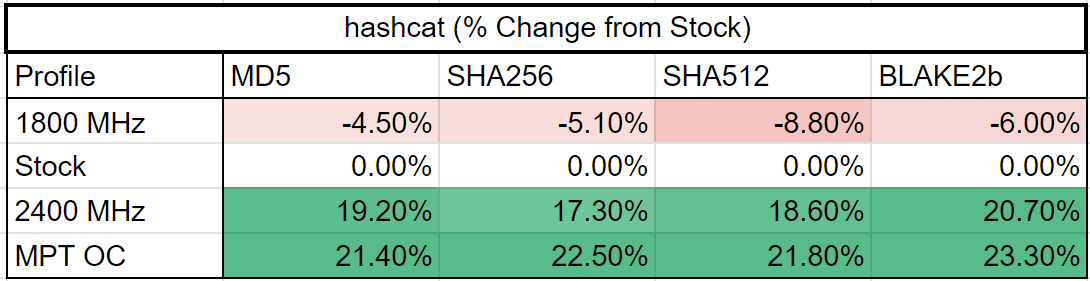
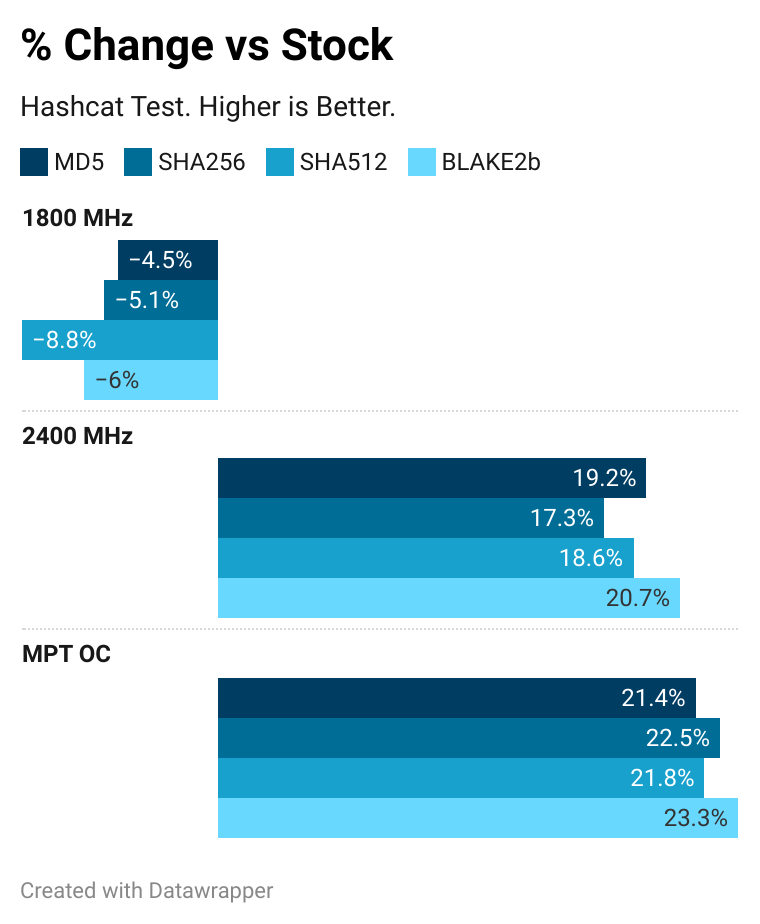
hashcat
- v7.1.2
- OpenCL
- Optimized Kernel Enabled
Hashcat is a password cracker. The performance increase from overclocking was impressive in hashcat, but MPT only increased hashrates by a small amount over the Adrenalin OC. Retests sometimes even had it perform worse than the Adrenalin OC in MD5 and BLAKE2b. SHA256 was the only algorithm that showed a relevant increase. Units are Megahashes per second.
| Profile | MD5 | SHA256 | SHA512 | BLAKE2b |
|---|---|---|---|---|
| 1800 MHz | 34616.4 MH/s | 5652.2 MH/s | 1154.4 MH/s | 2474.8 MH/s |
| Stock | 36247.4 MH/s | 5957.8 MH/s | 1266.2 MH/s | 2631.9 MH/s |
| 2400 MHz | 43214.1 MH/s | 6986.4 MH/s | 1502.1 MH/s | 3176.2 MH/s |
| MPT OC | 44015.8 MH/s | 7299.1 MH/s | 1542.1 MH/s | 3246.2 MH/s |
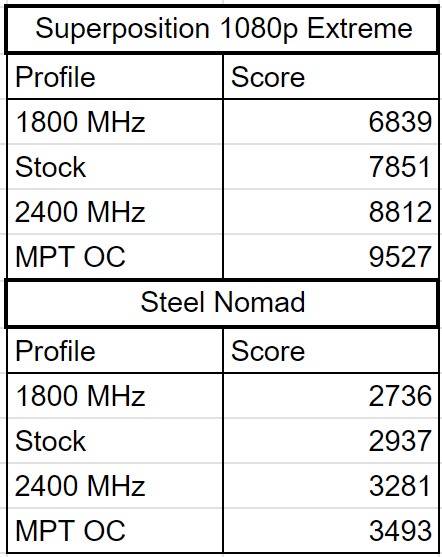
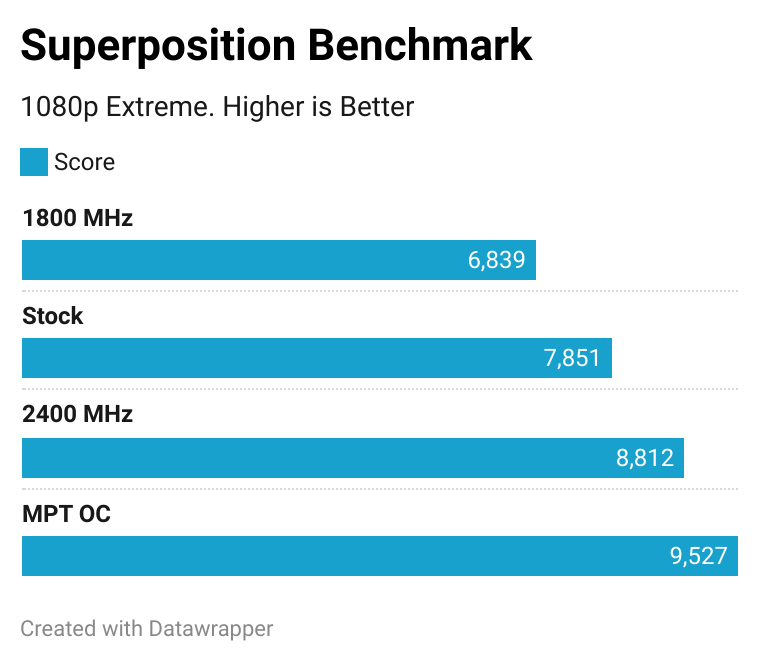
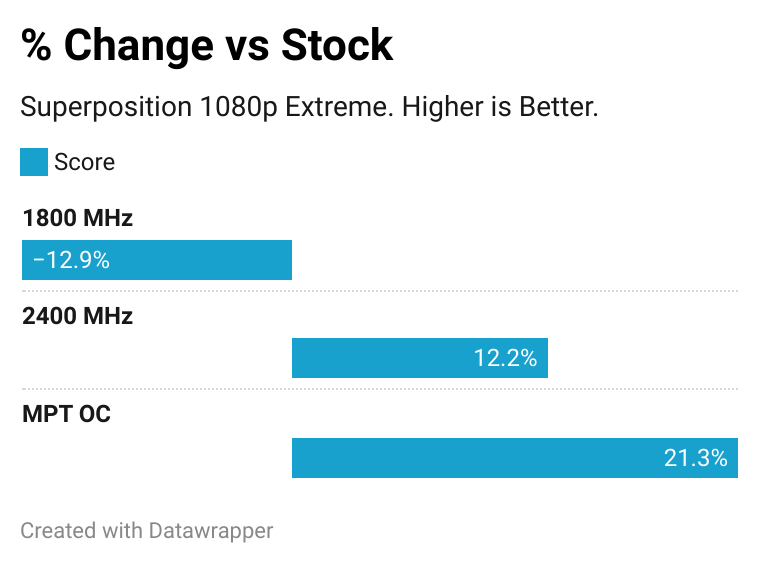
Superposition
There are no per-card averages for this benchmark online. From various sources, a normal RX 6800 scores around 8200 on this benchmark, while the RX 6800 XT tends to score around 10500.
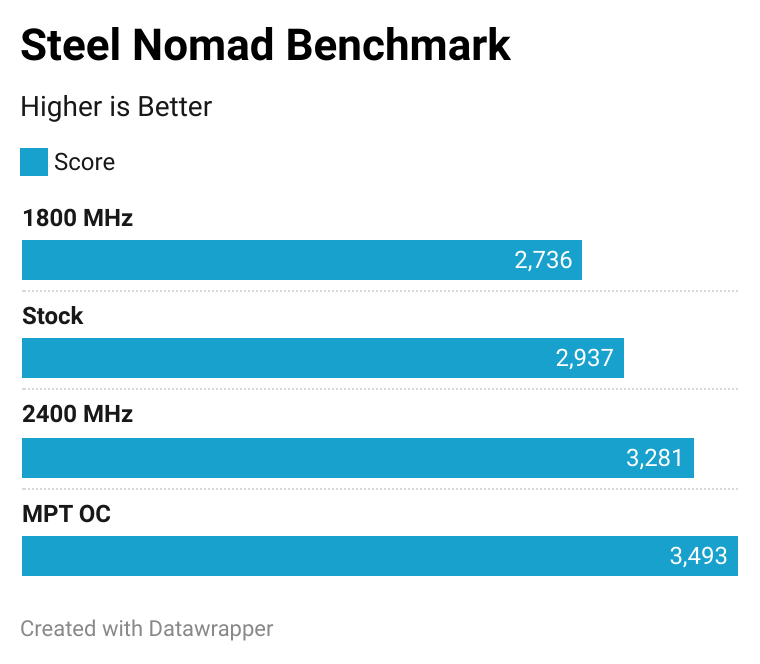
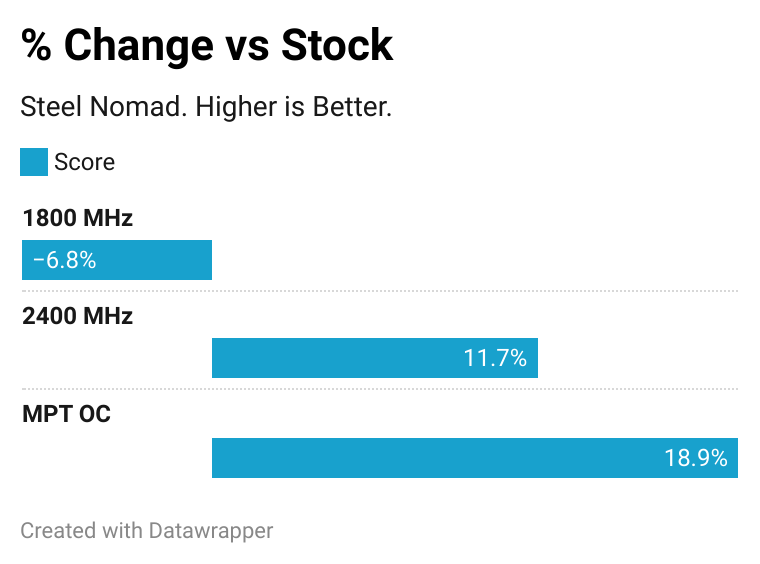
Steel Nomad
The average Steel Nomad score on an RX 6800 XT is 3683, while the average for the RX 6800 is 3188. Not quite able to close the gap, but it gets close.
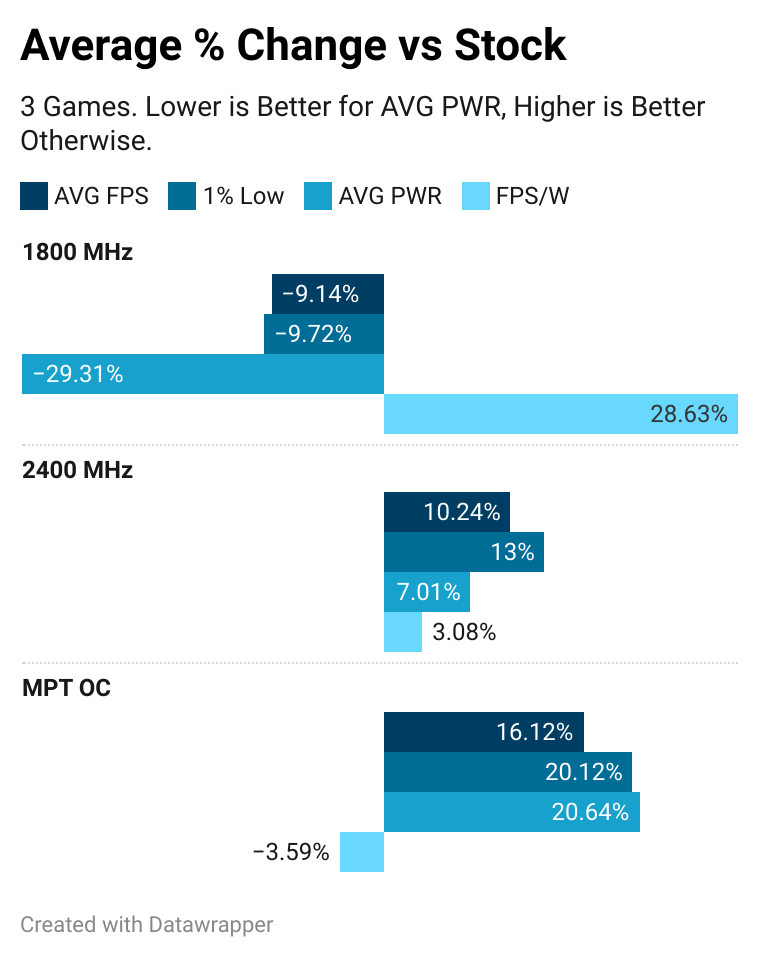
Averages
Without Black Mesa's 0.8% increase skewing the data, MPT's FPS increase over stock nears 20%.
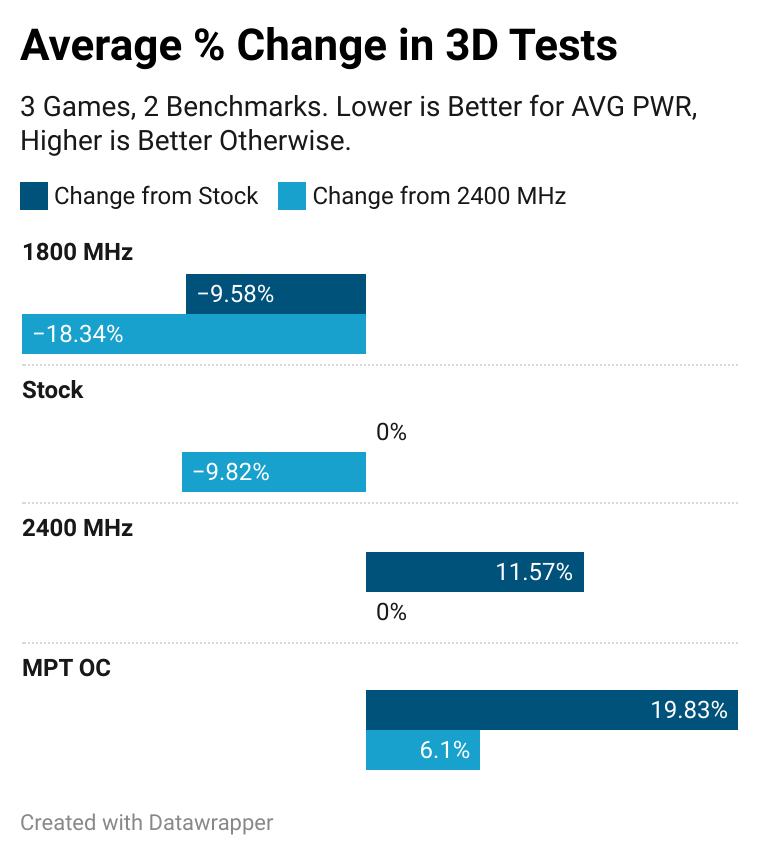
Conclusion
By overclocking with MorePowerTool, the RX 6800 can almost get a 20% increase in performance. This comes at the cost of 20% greater power consumption and a decrease in efficiency. The benefits of MPT over the Adrenalin only OC are also evident - an extra 6% is nothing to scoff at when trying to close the gap with the 6800 XT.
MorePowerTool is a fun way to push the most out of an RDNA2 GPU. You can get some extra performance out of your card and hold off on upgrading for a bit. Personally, I won't be daily driving it, even when the card nears its performance limit. Increasing current tends to lead to increase coil whine, and my card already has pretty bad coil whine at stock settings. Overclocking, with or without MPT, really makes it scream.
The most demanding game tested here is BeamNG, a driving game which doesn't particularly care about input latency. Rather than overclocking, I instead use AFMF 2 which provides a smooth experience without excessive coil whine and fan noise.
The most interesting part of this whole test was realizing how little is lost from the coil whine reducing profile. Because of the undervolt, the 15% reduction in maximum clocks only results in an average 9% decrease in performance while increasing FPS/W by a whopping 29%.
Data
Tables with the benchmark & test data.
Data